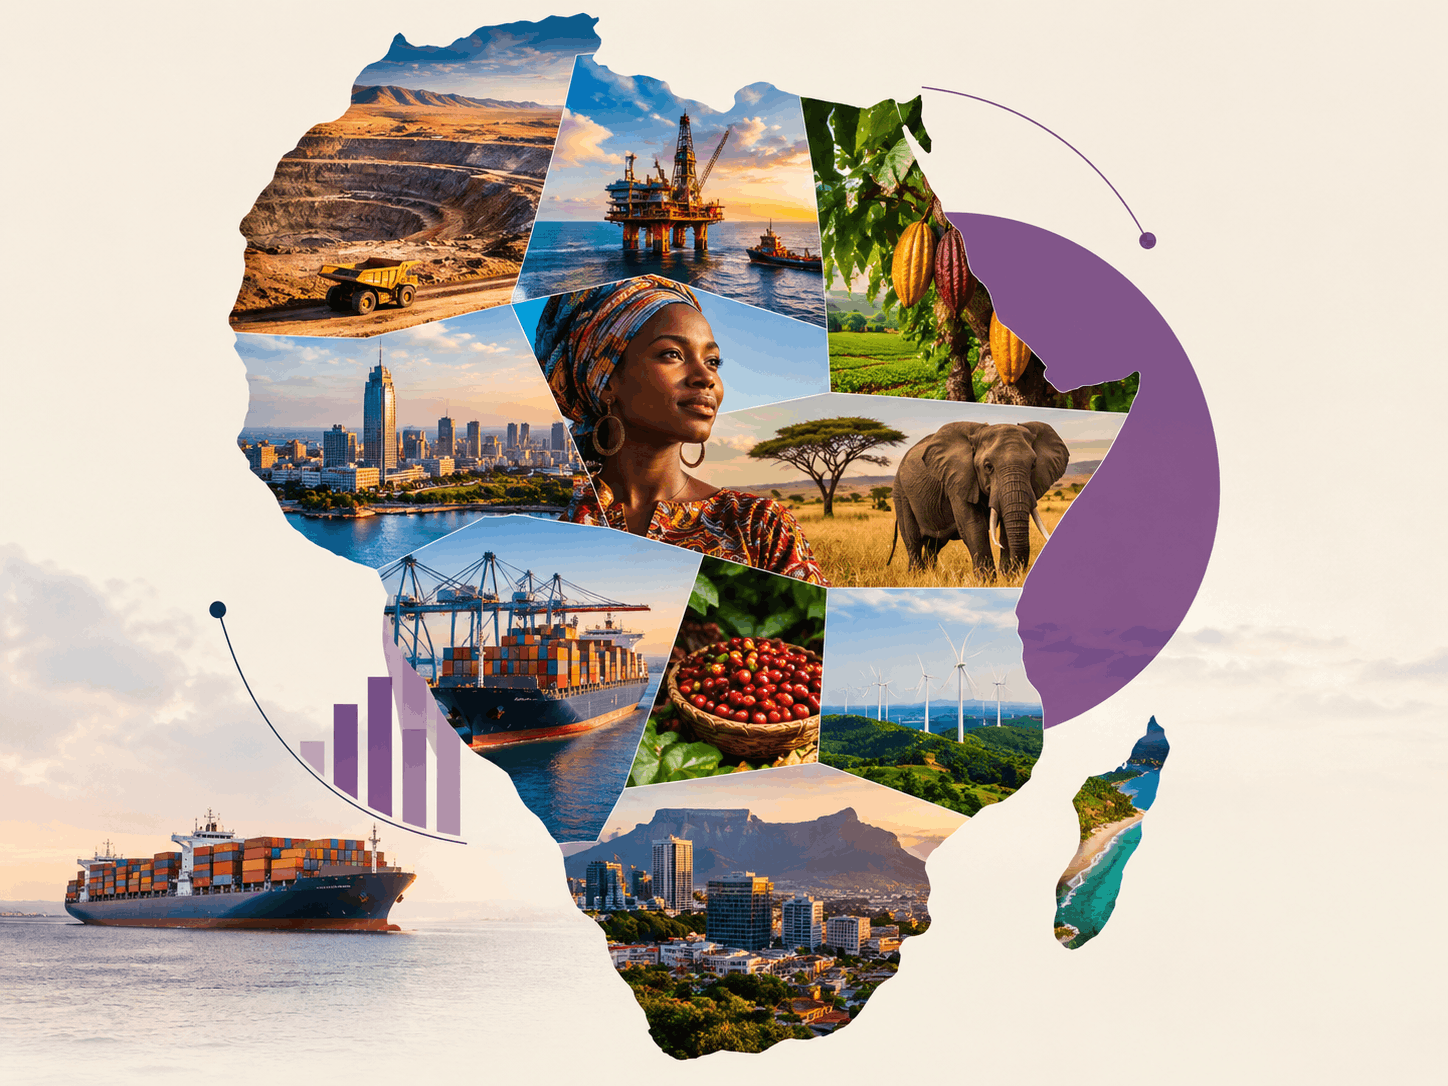
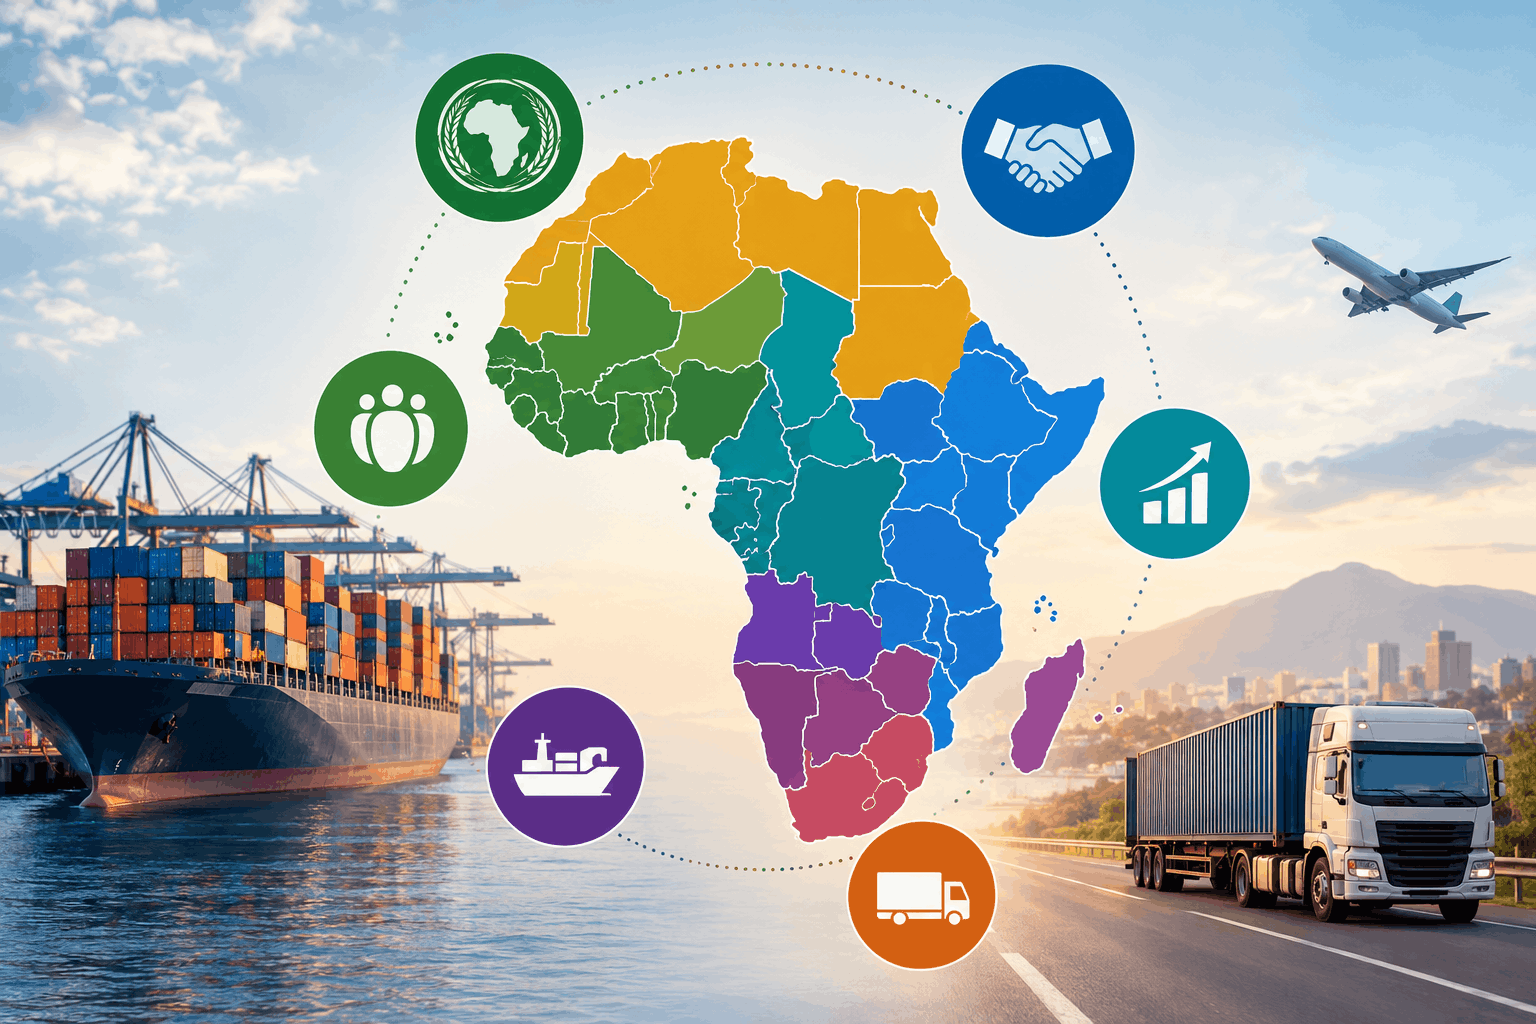
An overview of all 54 African economies by region: the size of each economy, what each country exports, which trade blocs it belongs to and how the continent's markets compare.
Africa is one continent, but it is not one market.
The 54 UN-recognised African states covered in this series range from economies worth hundreds of billions of dollars to countries with annual economic output of barely over a billion. Some are major oil and gas exporters. Others depend on minerals, agricultural commodities, manufacturing, tourism, financial services or their position along an important trade route.
Even countries that sit next to each other can have very different economic structures, currencies, trading partners and business conditions.
The figures in this article give a starting point for understanding those differences.
One continent, 54 very different markets
In this section
GDP figures in this article use the IMF World Economic Outlook database, April 2026, and refer to 2026 projections in current US dollars.
Add up the IMF's April 2026 projections for the 54 African economies covered here and their combined nominal GDP comes to about US$3.57 trillion.
That total is distributed unevenly.
South Africa, Egypt and Nigeria together account for about 36% of the continent's combined GDP. Add Algeria and Morocco and the five largest economies account for just over half.
At the other end of the table, the 27 smallest economies together account for less than 8% of the total. Fifteen African economies have projected GDP below US$10 billion. São Tomé and Príncipe, the smallest economy in the dataset, is projected at about US$1.2 billion.
GDP size, however, tells only part of the story.
Seychelles and Mauritius have projected GDP per person above US$13,000, while Burundi, South Sudan and Mozambique are below US$650. Ethiopia is projected to grow by more than 9% in 2026, while Equatorial Guinea is projected to contract.
Export structures vary just as sharply. Angola remains heavily dependent on oil. Zambia's exports are strongly tied to copper. Guinea's economy has a major mining base, while Côte d'Ivoire and Ghana are major cocoa producers. Morocco has developed large automotive and electrical-component industries alongside its phosphate and agricultural exports. Egypt has a broader mix that includes energy, fertilisers, manufactured goods, agricultural products, tourism, the Suez Canal and income from Egyptians working abroad.
South Africa also has a broad manufacturing and services base, although it should not be described as one of the continent's non-commodity-dependent economies. UN Trade and Development classifies South Africa among Africa's commodity-dependent economies in its 2025 assessment.
This article is the hub for Ria's Colony's Africa's Markets, Country by Country series. The first two posts explained how to read an African economy and how Africa's trade blocs work. This one brings all 54 countries together, grouped by region.
The tables give a quick view of economic size, GDP per person, projected growth, indicative goods exports and major regional groupings. As individual country profiles are published, the country names in the tables will link to them.
A note on the numbers
GDP figures in this article use the IMF World Economic Outlook database, April 2026, and refer to 2026 projections in current US dollars. These figures can change with exchange rates and will be revised as the IMF updates its forecasts.
Eritrea is different. The IMF does not provide a current 2026 GDP projection for Eritrea in this dataset, so the table uses the available UN-based figure for 2023. Its GDP, GDP per person and growth figure should therefore all be read as 2023 data rather than 2026 data.
The export column is a quick guide to important goods exported by each country. It is not a ranking of the five largest exports in every case, and the countries do not all use the same reference year. Individual country profiles will give the detailed trade figures.
The African Union has 55 members because it includes the Sahrawi Arab Democratic Republic. This series covers 54 UN-recognised African states and therefore excludes Western Sahara/SADR from the country count.
The continent in numbers
In this section
Nigeria accounts for about 45% of West Africa's GDP, while South Africa accounts for about 59% of Southern Africa's.
The concentration of economic output becomes clear when the countries are viewed together.
The 12 largest economies account for about 75% of Africa's combined GDP. The remaining 42 economies together produce less than South Africa and Egypt combined.
That does not mean the smaller markets are insignificant.
A country's economic importance can come from factors other than the size of its domestic economy. Rwanda, Mauritius, Botswana and Cabo Verde are relatively small economies, for example, but their geographic position, infrastructure, institutions, tourism sectors or role as regional business bases can give them influence beyond their GDP figures.
The same concentration appears inside the regions.
Nigeria accounts for about 45% of West Africa's GDP, while South Africa accounts for about 59% of Southern Africa's. The Democratic Republic of Congo represents roughly 44% of Central Africa's GDP.
North Africa is particularly concentrated in economic terms. Its six countries together account for about 30% of Africa's total GDP and have the highest average GDP per person of the five regions used in this series.
Region
Countries
Combined GDP, 2026
Share of Africa's GDP
North Africa
6
US$1,069bn
29.9%
West Africa
15
US$834bn
23.3%
Southern Africa
10
US$820bn
22.9%
East Africa and the islands
14
US$569bn
15.9%
Central Africa
9
US$281bn
7.9%
Regional totals and shares are calculated from the country-level IMF figures used in this article. Percentages may not sum to exactly 100% because of rounding.
North Africa
In this section
The Arab Maghreb Union has been largely inactive, while the land border between Algeria and Morocco has been closed since 1994.
North Africa contains only six of the 54 countries covered here, but together they produce almost 30% of the continent's GDP.
The region includes three of Africa's five largest economies: Egypt, Algeria and Morocco. It also has the highest average GDP per person of the five regions used in this series.
The Mediterranean shapes much of the region's trade. Europe is an important trading partner for most North African economies, while the region's ports provide links into European, Middle Eastern and African markets.
There is, however, a difference between economic size and regional integration. Trade between North African countries remains relatively limited. The Arab Maghreb Union has been largely inactive, while the land border between Algeria and Morocco has been closed since 1994.
Algeria and Libya remain heavily dependent on oil and natural gas. Egypt, Morocco and Tunisia have more varied economies.
Morocco has developed a substantial automotive manufacturing industry, with Tanger Med playing an important role in its international supply chains. The country is also a major exporter of phosphates and fertiliser products.
Tunisia has developed manufacturing links with European companies, particularly in electrical components, clothing and machinery, while agriculture remains important, including olive oil and dates.
Egypt's sources of foreign exchange include energy, the Suez Canal, tourism, remittances and merchandise exports such as fertilisers, agricultural products and manufactured goods.
Mauritania sits geographically between North and West Africa. Its export economy includes iron ore, gold and fish, and it has become a gas producer through the Greater Tortue Ahmeyim project shared with Senegal.
For businesses, the region combines large consumer markets, established manufacturing bases, major ports and relatively close links with European supply chains. Morocco and Egypt also have companies with operations elsewhere in Africa, including banks, telecoms businesses, contractors and manufacturers.
North Africa by country
Country
GDP 2026 (US$bn)
GDP per person (US$)
Growth 2026
Indicative main goods exports
Regional groupings
Egypt
429.6
3,904
4.2%
Natural gas and petroleum products, fertilisers, gold, citrus, clothing
Cars and parts, phosphates and fertilisers, wiring, clothing, fruit and vegetables
AMU
Tunisia
60.7
4,893
2.1%
Electrical wiring and machinery, clothing, olive oil, dates
AMU, COMESA
Libya
52.5
6,962
6.7%
Crude oil, natural gas, refined fuels
AMU, COMESA
Mauritania
14.4
3,033
4.4%
Iron ore, gold, fish, copper
AMU
West Africa
In this section
Burkina Faso, Mali and Niger are no longer ECOWAS members.
West Africa has 15 countries and accounts for about 23% of Africa's combined GDP.
Nigeria is by far the region's largest economy, accounting for about 45% of West Africa's output. Ghana and Côte d'Ivoire are the next largest economies, and the three together account for roughly three quarters of regional GDP.
The region also contains several fast-growing economies. The IMF's April 2026 projections put Guinea, Benin, Niger and Côte d'Ivoire above 6% growth for the year.
West Africa's export base remains heavily concentrated in commodities, although the type of commodity differs from country to country.
Nigeria's exports are dominated by crude oil and natural gas. Ghana is a major gold producer and also exports cocoa and crude oil. Ghana's 2025 gold production kept it ahead of South Africa and Mali.
Côte d'Ivoire and Ghana are particularly important to the global cocoa trade. Together they account for around half or more of world cocoa production depending on the season, although their combined share varies from year to year.
Guinea has major bauxite resources and exports large quantities of bauxite and alumina. Its iron ore industry has also entered a new phase: the Simandou project began exporting iron ore in late 2025.
Mali and Burkina Faso remain heavily dependent on gold. Niger has important uranium and oil exports.
Senegal's offshore energy industry has developed in stages. The Sangomar field achieved first oil in June 2024. The Greater Tortue Ahmeyim gas project, shared with Mauritania, began its LNG export phase in 2025.
Several smaller coastal economies also draw much of their economic importance from their ports. Togo and Benin, for example, serve as entry points for goods moving towards landlocked neighbouring countries and the wider regional market.
West Africa also has several different regional arrangements.
The West African CFA franc is used by eight countries and is linked to the euro. Other countries use national currencies, including the naira, cedi, dalasi and leone.
The region's trading system is not limited to formal customs arrangements. Cross-border trade along routes such as the Abidjan-Lagos corridor connects Côte d'Ivoire, Ghana, Togo, Benin and Nigeria and supports large volumes of both formal and informal commerce.
Burkina Faso, Mali and Niger are no longer ECOWAS members. Their withdrawal took effect in January 2025. They are instead linked politically through the Alliance of Sahel States, or AES, and the table below shows them that way.
Phosphates, cotton, re-exports, clinker and cement
ECOWAS, WAEMU
Sierra Leone
8.3
919
4.6%
Iron ore, diamonds, rutile, cocoa
ECOWAS
Liberia
5.6
964
5.1%
Gold, iron ore, rubber
ECOWAS
Cabo Verde
3.4
6,670
4.8%
Fish and canned fish
ECOWAS
Guinea-Bissau
3.0
1,449
4.9%
Cashews
ECOWAS, WAEMU
The Gambia
2.8
953
5.1%
Re-exports, groundnuts, fish
ECOWAS
Central Africa
In this section
The Lobito Corridor has become an important route for copper and cobalt exports towards Angola's Atlantic coast.
Central Africa contains nine countries and has the smallest combined share of Africa's GDP, at about 8%.
It is nevertheless one of the continent's most resource-rich regions. The region includes major deposits of copper, cobalt, oil, manganese, gold and other minerals, as well as much of the Congo Basin rainforest.
The Democratic Republic of Congo dominates the region economically, accounting for roughly 44% of its GDP.
The DRC is one of the world's leading producers of cobalt and a major producer of copper. Much of the country's mineral production comes from the southeast, where transport routes connect mines to ports and international markets. The Lobito Corridor has become an important route for copper and cobalt exports towards Angola's Atlantic coast.
Cameroon has one of the region's more diversified economies, with oil, timber, cocoa, coffee, bananas and cotton among its important exports. The port of Douala also serves as an important gateway for landlocked Chad and the Central African Republic.
Gabon, the Republic of Congo and Equatorial Guinea remain heavily dependent on hydrocarbons. This gives some of them relatively high GDP per person while also leaving their economies exposed to changes in oil production and prices.
Equatorial Guinea is projected to contract in 2026 as declining oil production continues to weigh on the economy.
Gabon is also a major manganese producer and has developed more timber processing after restrictions on exports of unprocessed logs.
Six of the nine countries use the Central African CFA franc through CEMAC. The DRC, Burundi and São Tomé and Príncipe use their own currencies.
Regional trade remains relatively limited, while long transport distances, infrastructure gaps and security conditions can make cross-border commerce difficult.
Kenya is the largest economy in the region at about US$147 billion, followed by Ethiopia, Tanzania and Uganda.
East Africa and the Indian Ocean islands account for about 16% of Africa's combined GDP in this grouping.
The region includes several of the continent's faster-growing economies. The IMF projects Ethiopia to grow by 9.2% in 2026, Uganda by 7.5%, Rwanda by 7.2% and Tanzania by 5.9%.
Kenya is the largest economy in the region at about US$147 billion, followed by Ethiopia, Tanzania and Uganda.
Ports are central to the region's trade.
Mombasa and Dar es Salaam serve large hinterlands stretching into landlocked countries around the Great Lakes. The Northern and Central Corridors connect countries including Uganda, Rwanda, Burundi, South Sudan and the eastern DRC to the coast.
Djibouti plays a particularly important role for Ethiopia, whose foreign trade relies heavily on the port and transport connections linking the two countries.
The East African Community has also created a framework for regional integration, including a customs union and common-market arrangements. Kenya's banks, telecoms companies, retailers and other businesses have expanded into neighbouring markets.
Agriculture and minerals dominate many export baskets.
Kenya is a major exporter of black tea and cut flowers and also exports coffee, fruit and vegetables. Ethiopia is Africa's largest coffee producer. Uganda is a major coffee exporter, while Tanzania and Uganda are significant gold exporters.
Madagascar is the world's largest producer and exporter of natural vanilla. Its export share is particularly large even though its share of global production is considerably lower than some commonly repeated online claims suggest.
The Indian Ocean islands have different economic structures. Mauritius and Seychelles have the highest GDP per person in Africa in the IMF figures used here, with tourism, financial services and other service industries playing major roles. Mauritius also has manufacturing and sugar, while Seychelles has a large tuna-processing and fishing industry.
Sudan presents a very different picture. The war that began in April 2023 has severely damaged the country's economy.
South Sudan remains heavily dependent on oil, much of which has historically moved through a pipeline across Sudan to reach export markets.
There have also been recent changes to regional memberships. Rwanda withdrew from ECCAS in June 2025 and remains a member of the East African Community and COMESA. Sudan resumed full participation in IGAD in February 2026, while Eritrea formally withdrew from IGAD in December 2025.
East Africa and the islands by country
Country
GDP 2026 (US$bn)
GDP per person (US$)
Growth 2026
Indicative main goods exports
Regional groupings
Kenya
147.3
2,714
4.5%
Tea, cut flowers, coffee, fruit and vegetables, clothing
EAC, COMESA, IGAD
Ethiopia
121.5
1,081
9.2%
Coffee, gold, oilseeds, cut flowers, vegetables
COMESA, IGAD
Tanzania
94.9
1,362
5.9%
Gold, cashews, tobacco, coffee, minerals
EAC, SADC
Uganda
73.4
1,476
7.5%
Gold, coffee, fish, sugar, dairy
EAC, COMESA, IGAD
Sudan
44.7
864
0.7%
Gold, livestock, sesame, gum arabic
COMESA, IGAD
Madagascar
21.2
656
3.6%
Vanilla, nickel, cobalt, clothing, cloves
COMESA, SADC
Rwanda
17.3
1,198
7.2%
Gold, coffee, tea, tin and other minerals
EAC, COMESA
Mauritius
17.1
13,812
3.4%
Clothing, fish and canned tuna, sugar
COMESA, SADC
Somalia
14.2
813
2.6%
Livestock, sesame, gold
EAC, COMESA, IGAD
South Sudan
6.1
488
4.1%
Crude oil
EAC, IGAD
Djibouti
4.7
4,421
6.0%
Re-exports and port services
COMESA, IGAD
Eritrea
2.3*
656*
n/a*
Zinc, copper, gold
COMESA
Seychelles
2.3
17,675
1.5%
Canned and frozen tuna
COMESA, SADC
Comoros
1.8
1,951
4.1%
Cloves, vanilla, ylang-ylang
COMESA, SADC
Eritrea's figures are UN-based 2023 data, not IMF 2026 projections. Eritrea withdrew from IGAD in December 2025.
Southern Africa
In this section
South Africa accounts for nearly 59% of the region's output and remains the continent's largest economy.
Southern Africa contains ten countries and accounts for about 23% of Africa's combined GDP.
South Africa accounts for nearly 59% of the region's output and remains the continent's largest economy.
Its economy is considerably more diversified than many commodity-dependent African economies. It has large financial, manufacturing, mining, agricultural and services sectors, including automotive manufacturing, chemicals, machinery and processed food.
Growth, however, is projected at only about 1% in 2026.
The rest of Southern Africa contains several major mineral economies.
Botswana has long depended heavily on diamonds. Zambia's export economy is strongly linked to copper. Zimbabwe exports gold, tobacco, platinum-group metals and lithium, while Namibia has major uranium and diamond exports.
Angola is the region's second-largest economy and one of Africa's major oil producers.
Mozambique has substantial coal, aluminium and natural gas operations. Its northern gas development has been affected by the insurgency in Cabo Delgado, while political unrest following the 2024 election has also affected economic activity.
Southern Africa has unusually dense economic links between neighbouring countries.
The Southern African Customs Union, or SACU, links South Africa, Botswana, Namibia, Lesotho and Eswatini in a customs union. South African goods also move extensively through the region by road and rail.
The Common Monetary Area links South Africa, Lesotho, Namibia and Eswatini, with the South African rand playing an important monetary role in the smaller economies.
Ports including Durban, Walvis Bay and Maputo provide routes to the sea for landlocked economies. The Lobito Corridor also provides a route from the copper and cobalt-producing areas of the DRC and Zambia towards Angola's Atlantic coast.
Southern Africa by country
Country
GDP 2026 (US$bn)
GDP per person (US$)
Growth 2026
Indicative main goods exports
Regional groupings
South Africa
480.0
7,503
1.1%
Platinum-group metals, gold, coal, iron ore, cars, citrus, machinery
Botswana, Burkina Faso, Burundi, Central African Republic, Chad, Eswatini, Ethiopia, Lesotho, Malawi, Mali, Niger, Rwanda, South Sudan, Uganda, Zambia and Zimbabwe.
Looking at the 54 economies together makes several patterns easier to see.
Commodity dependence remains widespread
Oil and gas, gold, copper, cocoa, diamonds, cotton and coffee appear repeatedly in African export baskets.
UN Trade and Development's State of Commodity Dependence 2025 defines an economy as commodity-dependent when commodities account for more than 60% of merchandise exports. Its analysis found that 46 of Africa's 54 countries were commodity-dependent during 2021 to 2023.
The eight African economies classified as non-commodity-dependent in that dataset were Tunisia, Morocco, Egypt, Djibouti, Comoros, Mauritius, Eswatini and Lesotho.
This does not mean that every other economy exports only raw materials, or that commodity-dependent countries have no manufacturing or services sectors. It means that commodities remain dominant in their merchandise exports.
That distinction is useful when comparing markets. A country can have a sophisticated services sector while still relying heavily on one or two commodities for export earnings.
Size, income and growth tell different stories
The largest economy is not necessarily the richest per person, and the richest economy per person is not necessarily among the largest.
South Africa is Africa's largest economy in the IMF's 2026 projections but has one of the lowest projected growth rates among the larger economies.
Ethiopia is projected to grow by 9.2%, but its GDP per person remains relatively low.
Seychelles has the highest GDP per person in the dataset while having one of the continent's smallest economies in absolute terms.
For a business, those differences can lead to very different questions.
A company selling a mass-market consumer product may care heavily about population and total purchasing power. A financial services company may care more about income, regulation and the presence of regional headquarters. A manufacturer may care about ports, electricity, industrial suppliers and access to neighbouring markets.
GDP alone cannot answer those questions.
Geography changes the cost of trade
Sixteen African countries have no coastline:
Botswana, Burkina Faso, Burundi, Central African Republic, Chad, Eswatini, Ethiopia, Lesotho, Malawi, Mali, Niger, Rwanda, South Sudan, Uganda, Zambia and Zimbabwe.
Their international trade depends on neighbouring countries' ports, roads, railways and border procedures.
That makes transport infrastructure and regional corridors especially important.
A landlocked company does not only need to understand its own country's customs rules. It also needs to understand the route its goods take through other countries.
The reverse is also true for coastal economies.
Ports in countries such as Kenya, Tanzania, Djibouti, Togo and South Africa serve markets beyond their own borders. Their importance comes partly from the economies behind them.
Some smaller economies have regional importance beyond GDP
A country's domestic economy can be small while its role in regional business is much larger.
Mauritius has developed financial and investment services connected to African markets.
Rwanda has positioned Kigali as a location for conferences, regional organisations and business operations.
Kenya, Morocco, South Africa and Nigeria are home to companies that have expanded across neighbouring markets in sectors including banking, telecommunications, retail and consumer goods.
For an international company deciding where to set up its first African operation, market size is therefore only one consideration. Regulation, transport connections, regional market access, business networks and the ability to reach customers in neighbouring countries can all influence the decision.
How the series is ordered
In this section
Potential subjects include the Abidjan-Lagos corridor, the Northern Corridor, the Central Corridor and the Lobito Corridor.
The country profiles will not run in alphabetical order.
The opening set lays out the framework for understanding African economies and regional trade. The country profiles then move through the markets Ria's Colony is prioritising, followed by the remaining countries region by region.
The aim is to make the countries easier to understand individually while also showing how their markets connect to one another.
Phase
What it covers
Posts
Opening posts
How to Read an African Economy; Africa's Trade Blocs Explained; Africa's 54 Markets at a Glance
3
First markets
Nigeria, Ghana, Kenya, Rwanda
4
Second markets
Uganda, Tanzania, South Africa
3
West Africa
The other 13 West African countries, then a regional round-up
14
East Africa and the islands
The other 10 East African countries, then a regional round-up
11
Southern Africa
The other 9 Southern African countries, then a regional round-up
10
Central Africa
All 9 Central African countries, then a regional round-up
10
North Africa
All 6 North African countries, then a regional round-up
7
Two additional strands will run alongside the country profiles.
Follow the Product
These posts will trace individual products across borders, showing where they are grown or extracted, how they are processed, where they move and which markets depend on them.
Planned subjects include cocoa, coffee, cashews, gold, cobalt and cut flowers. About eight posts are planned.
Corridors
These posts will follow the routes that connect African markets.
Potential subjects include the Abidjan-Lagos corridor, the Northern Corridor, the Central Corridor and the Lobito Corridor. About five posts are planned.
Together, that makes 62 core posts, plus roughly 13 product and corridor posts, for about 75 posts across the wider series.
Each country profile will use the same basic structure: an economic snapshot, what the country sells and buys, its major trading partners inside and outside Africa, its regional economic communities and AfCFTA position, how goods move through its ports and borders, sectors with growth potential, the practical realities of doing business there, major risks and a fact box of key figures.
The first country profile in the series is Nigeria.